Trading the Final 16 Minutes
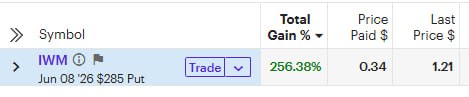
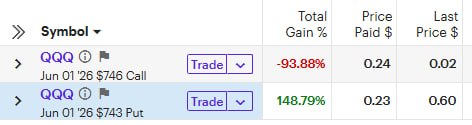
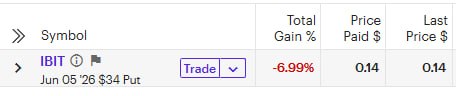
Ride the 3:44 ET. Call it a Speed Run if you like. If you only have time for one or two trades a week, this 16-minute window may be the best opportunity on the board. I trade the 3:44 ET two or three times a week, and sometimes daily.
This strategy trades the market’s version of a freight train leaving the station. The objective is not to predict where the tracks lead tomorrow. The objective is to identify which direction the train is already moving and hop aboard before it reaches the station at today’s closing bell.
During the final sixteen minutes of trading, institutional order flow, ETF rebalancing, dealer hedging, and closing auction imbalances begin to merge into a single force. Individually, these participants may have different motives. Collectively, they can create a powerful directional push. Like rail cars coupling together one by one, buying or selling pressure builds as the close approaches.
The strategy seeks to recognize that developing momentum early enough to ride the move into the closing auction. Rather than forecasting tomorrow’s destination, the focus is on measuring the weight, speed, and direction of the freight train that is already rolling down the tracks before the closing bell.
The Setup
Time Window:
- Entry Window: 3:44 PM ET to approximately 3:50 PM ET
- Exit Window: Before 4:00 PM ET expiration → No exceptions!
Vehicles:
- SPY 0DTE
- SPX 0DTE
- QQQ 0DTE
- Others (0DTE)
Position:
Purchase both:
- ATM Call
- ATM Put
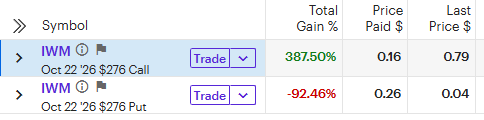
This creates a very short-duration ATM straddle.
The thesis is simple:
You don’t care which direction the market moves. You care that it moves enough.
Payoff Example
Assume SPY is trading at: $650.00
At 3:44 PM ET:
| Contract | Premium |
|---|---|
| 650 Call | $0.35 |
| 650 Put | $0.35 |
Total Cost:
$0.70
One spread pair costs:
$70 per set
Scenario A: Strong Rally Into Close
SPY settles at: $651.50
End Result:
| Contract | Value |
|---|---|
| 650 Call | $1.50 |
| 650 Put | $0.00 |
Total Position Value:
$1.50
Profit:
$1.50 – $0.70 = $0.80
Return:
+114%
Use the same strike for all legs. Premiums may differ, but position sizes should be equal dollar weighted.
Scenario B: Strong Selloff Into Close
SPY settles at: $648.75
End Result:
| Contract | Value |
|---|---|
| 650 Call | $0.00 |
| 650 Put | $1.25 |
Total Position Value:
$1.25
Profit:
$1.25 – $0.70 = $0.55
Return:
+79%
Scenario C: Pin at Strike
SPY settles at:
$650.05
End Result:
| Contract | Value |
|---|---|
| 650 Call | $0.05 |
| 650 Put | $0.00 |
Position Value:
$0.05
Loss:
$0.65
Return:
-93%
This is the risk most traders underestimate.
The market does not need to move against you.
It only needs to fail to move enough.
Understanding the 0DTE Cutoff Risk
The final sixteen minutes operate differently from the rest of the trading day.
By this point:
- Theta has effectively consumed nearly all extrinsic value.
- Gamma is near maximum.
- Delta changes occur extremely rapidly.
- Every penny matters.
A 25-cent move in SPY can completely transform an option’s value.
A 25-cent move in the opposite direction can eliminate it.
What appears cheap is often cheap for a reason.
Risk #1: Strike Pinning
This is the biggest danger.
Large option positions often accumulate around round-number strikes:
- 650
- 655
- 660
As dealers hedge around these strikes, price can become “sticky.”
The market may oscillate around the strike until expiration, causing both sides of the straddle to decay.
Pinning turns movement traders into premium donors.
Risk #2: Spread Expansion
At 3:55 PM ET:
You may see:
- $0.10 bid
- $0.25 ask
A contract worth $0.15 immediately shows a paper loss because of spread costs.
Your edge must overcome friction.
Risk #3: Auction Reversal
Some days the market trends strongly from:
3:00 PM ET to 3:55 PM ET
Then reverses sharply during the closing auction.
A trader entering late can be positioned perfectly for the move that just ended.
Many 0DTE traders become exit liquidity for larger participants.
Risk #4: Liquidity Evaporation
Near expiration:
- Market makers become selective
- Order flow becomes one-sided
- Bid/ask spreads become unstable
The option may have theoretical value but be difficult to exit efficiently.
Risk #5: Settlement Math
The underlying does not have to move much.
It must move enough to exceed:
Total Premium Paid
+
Execution Costs
+
Slippage
This is the true breakeven.
Many traders forget this calculation.
Trading Plan
Market Selection
Focus only on:
- SPY
- SPX
- QQQ
These products maintain the most consistent liquidity and institutional participation.
Avoid thinly traded names.
Trade Filter
Only trade when one of the following exists:
Event Day
- FOMC
- CPI
- Payrolls
- Major earnings concentration
OPEX Day
- Weekly OPEX
- Monthly OPEX
Triple Witching
March, June, September, December expiration Fridays.
Large Trend Day
Market already moving more than average daily range.
The objective is to participate when a closing imbalance is most likely.
Entry Rules
Time:
3:44 PM ET to 3:50 PM ET
Position:
Buy:
- 1 ATM Call
- 1 ATM Put
Equal dollar allocation.
No averaging.
No adding.
No chasing.
Profit Management
If one side doubles:
Consider selling enough contracts to recover initial risk.
Example:
Initial Cost = $100
Winning Side Value = $200
Sell half.
Now the remaining position is effectively house money.
Exit Rules
Hard Exit:
3:59 PM ET
No exceptions.
Do not hold expired lottery tickets hoping for an after-hours miracle.
The trade exists only because time still remains.
Once time is gone, so is the trade.
Position Sizing
Treat every entry as a total loss candidate.
A practical method:
Risk Per Trade:
0.25% to .65%
of option trading account value
Example:
| Account | Max Risk |
|---|---|
| $10,000 | $25-$65 |
| $50,000 | $125-$325 |
| $100,000 | $250-$650 |
The goal is surviving many attempts until the larger auction-driven moves appear.
Random Images