Elliott Wave Patterns are specific formations within Elliott Wave Theory, developed by Ralph Nelson Elliott in the 1930s, which traders use to analyze market movements. These patterns help identify trends and corrections in financial markets.
Types of Elliott Wave Patterns
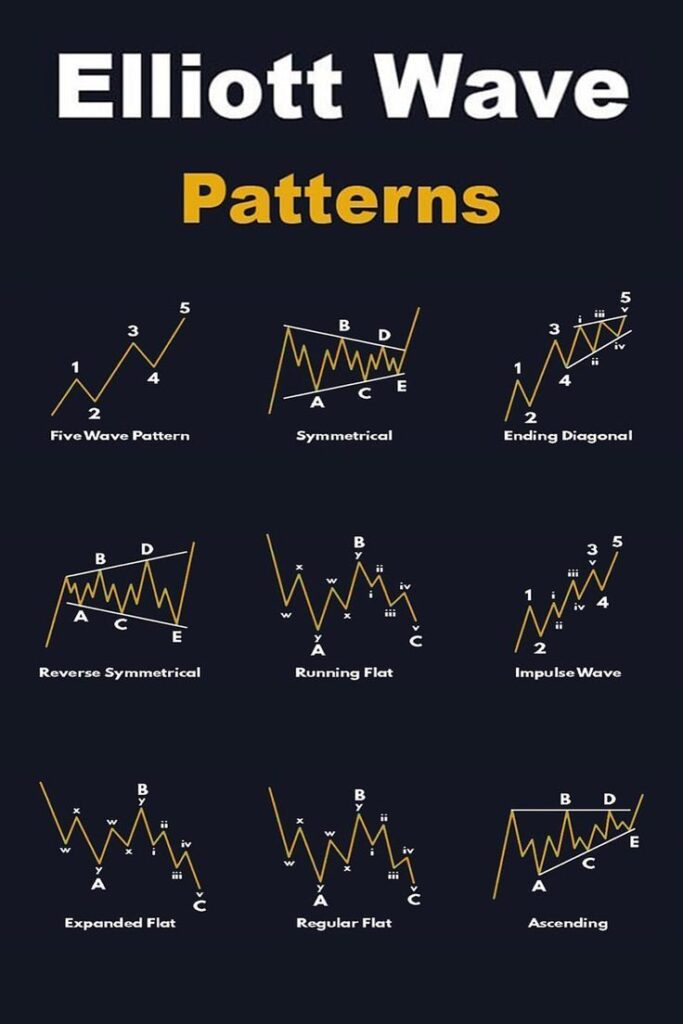
- Impulse Waves—These consist of five waves moving in the direction of the trend:
- Wave 1: Initial move in the trend’s direction.
- Wave 2: A pullback, but not a full retracement.
- Wave 3: The strongest wave, showing momentum.
- Wave 4: A smaller correction.
- Wave 5: The final push before a reversal or correction.
- Corrective Waves—These consist of three waves moving against the trend:
- Wave A: Begins the correction.
- Wave B: A temporary reversal.
- Wave C: Completes the correction.
- Complex Corrections—These include:
- Zigzags—Sharp corrections with a 5-3-5 structure.
- Flats—Sideways corrections with a 3-3-5 structure.
- Triangles—Consolidation patterns forming five waves.
Elliott Wave Patterns are fractal, meaning they appear on different timeframes and scales. Traders often use Fibonacci ratios to refine their wave analysis.
Fibonacci ratios play a crucial role in Elliott Wave analysis by helping traders identify potential reversal points and price targets within wave structures. These ratios are derived from the Fibonacci sequence, where each number is the sum of the two preceding numbers (e.g., 1, 1, 2, 3, 5, 8, etc.).